Gantt Chart
Overview
Gantt charts are useful project management tools that visually represent the schedule and progress of tasks or activities over time. They offer a clear and structured way to plan, coordinate, and track various elements of a project. Rapid has the ability to configure Gantt charts based on the Tasks and Sub-Types of Tasks in your system
Creating a Gantt Chart for your Table
Important note: Gantt charts can only be configured for the "Tasks" table or a table that is a subtype of the "Tasks" table.
A table is a subtype of the Tasks table if while creating the table, it has inherited the Tasks.
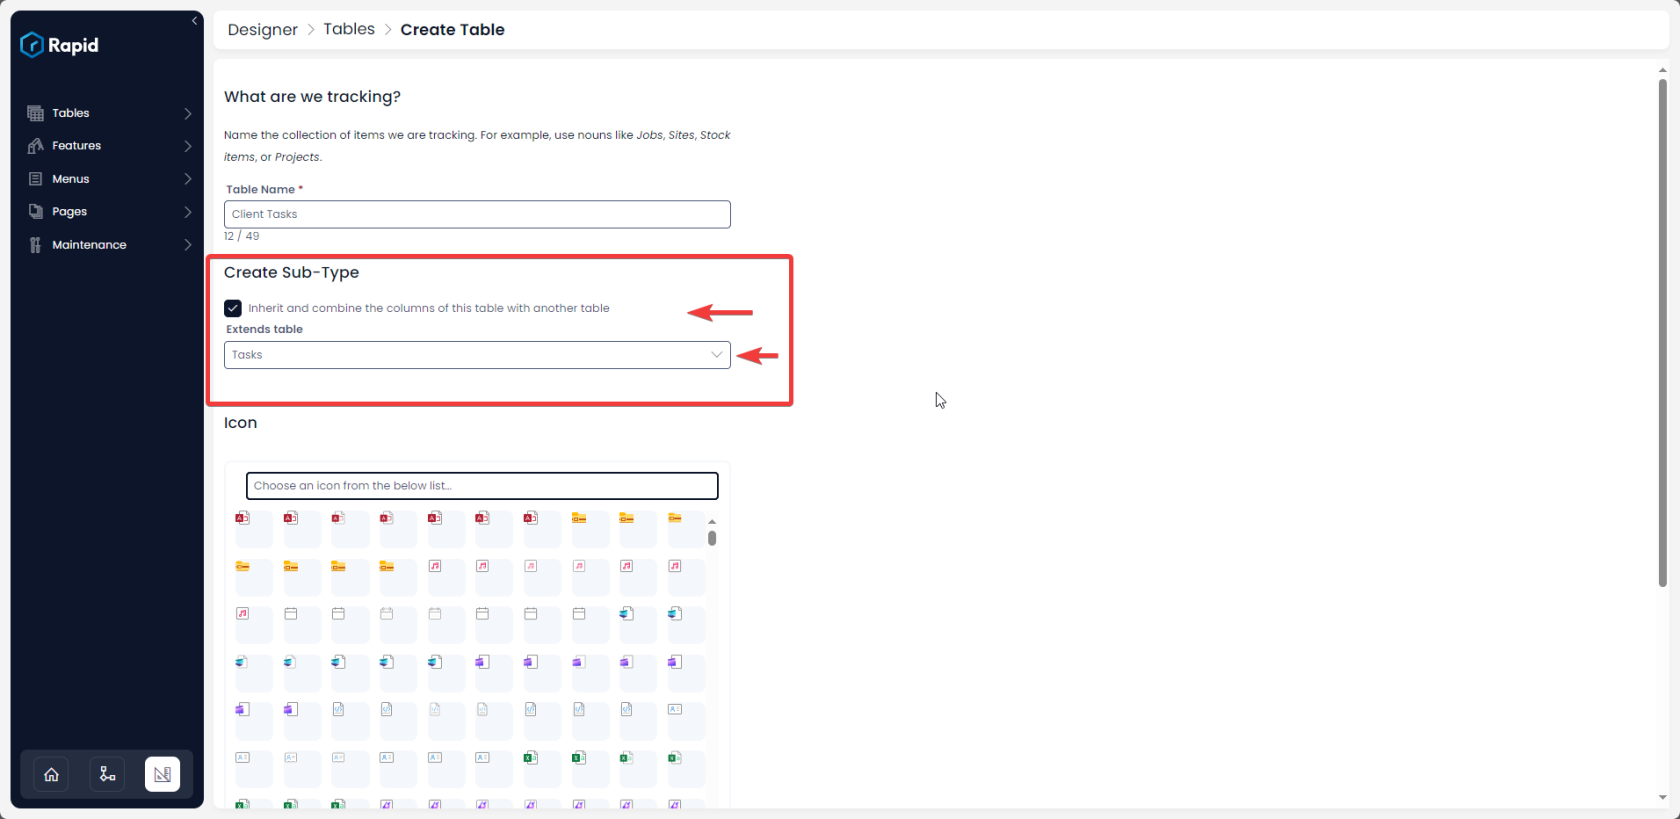
To learn more about how to create sub-type tables read our documentation on Table Creation Options.
Check if your Table qualifies for Gantt Chart
To check whether your desired table is a subtype of Tasks or not, please follow the below points:
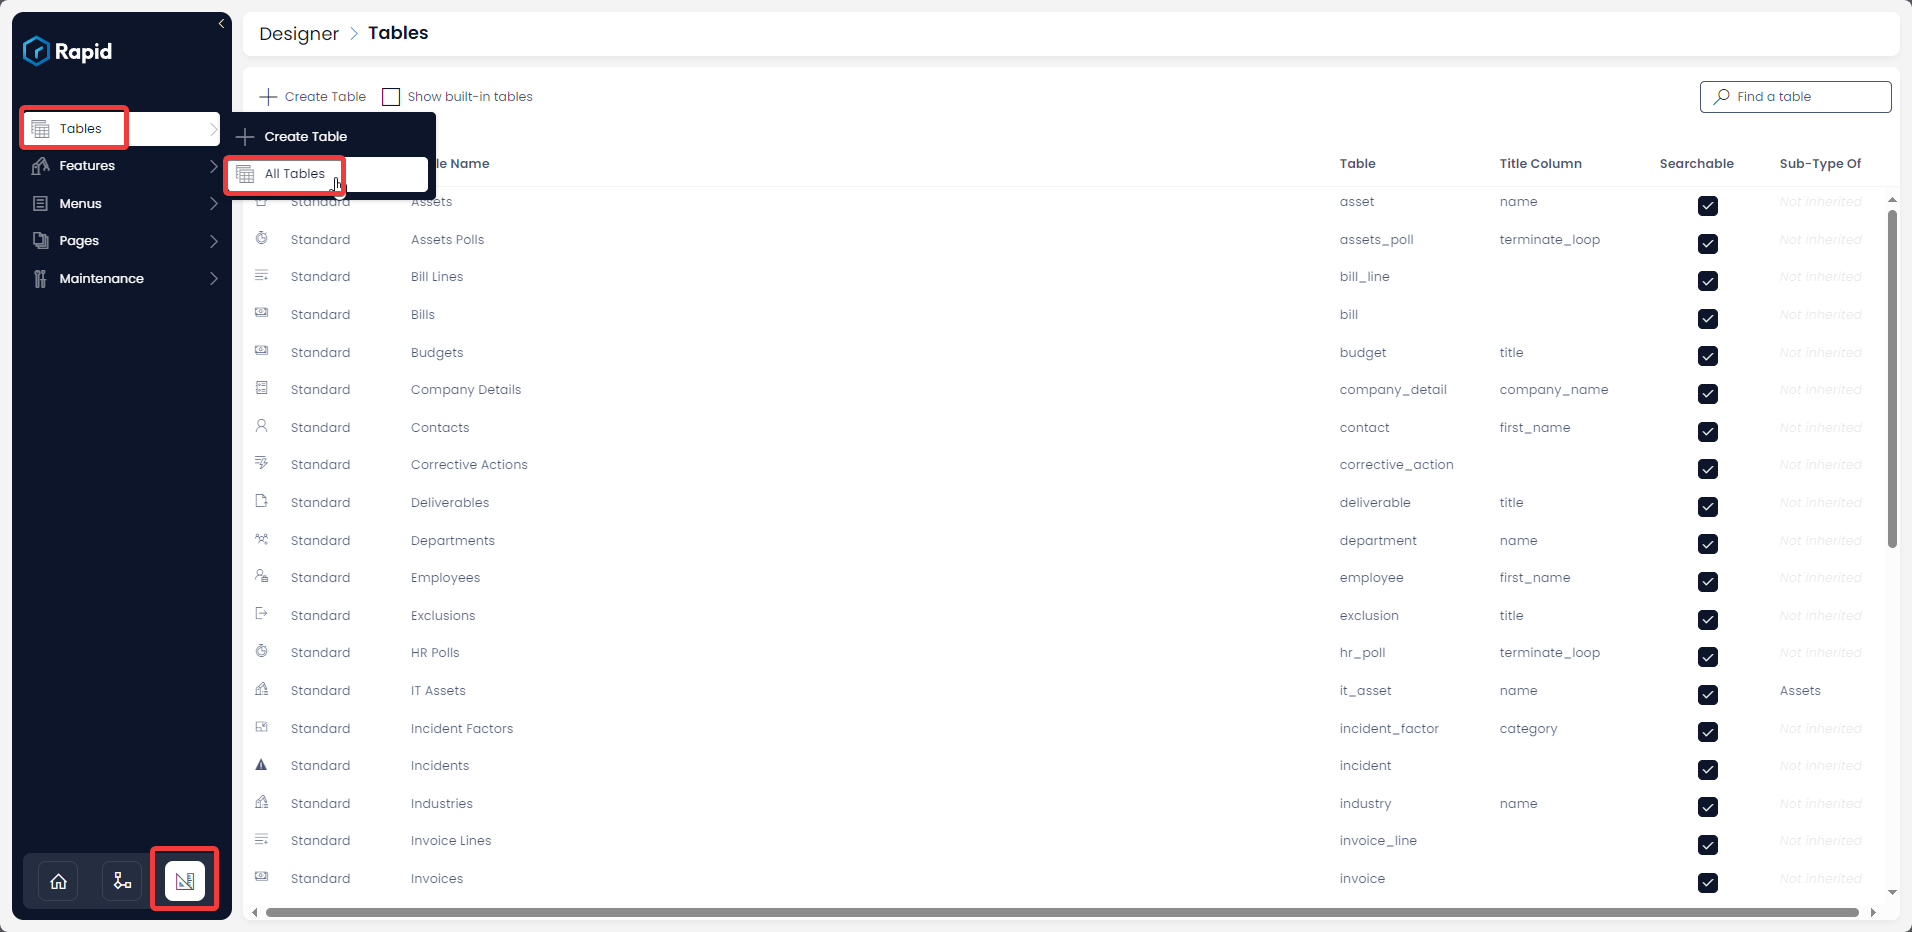
- Navigate to Designer > Tables > All Tables
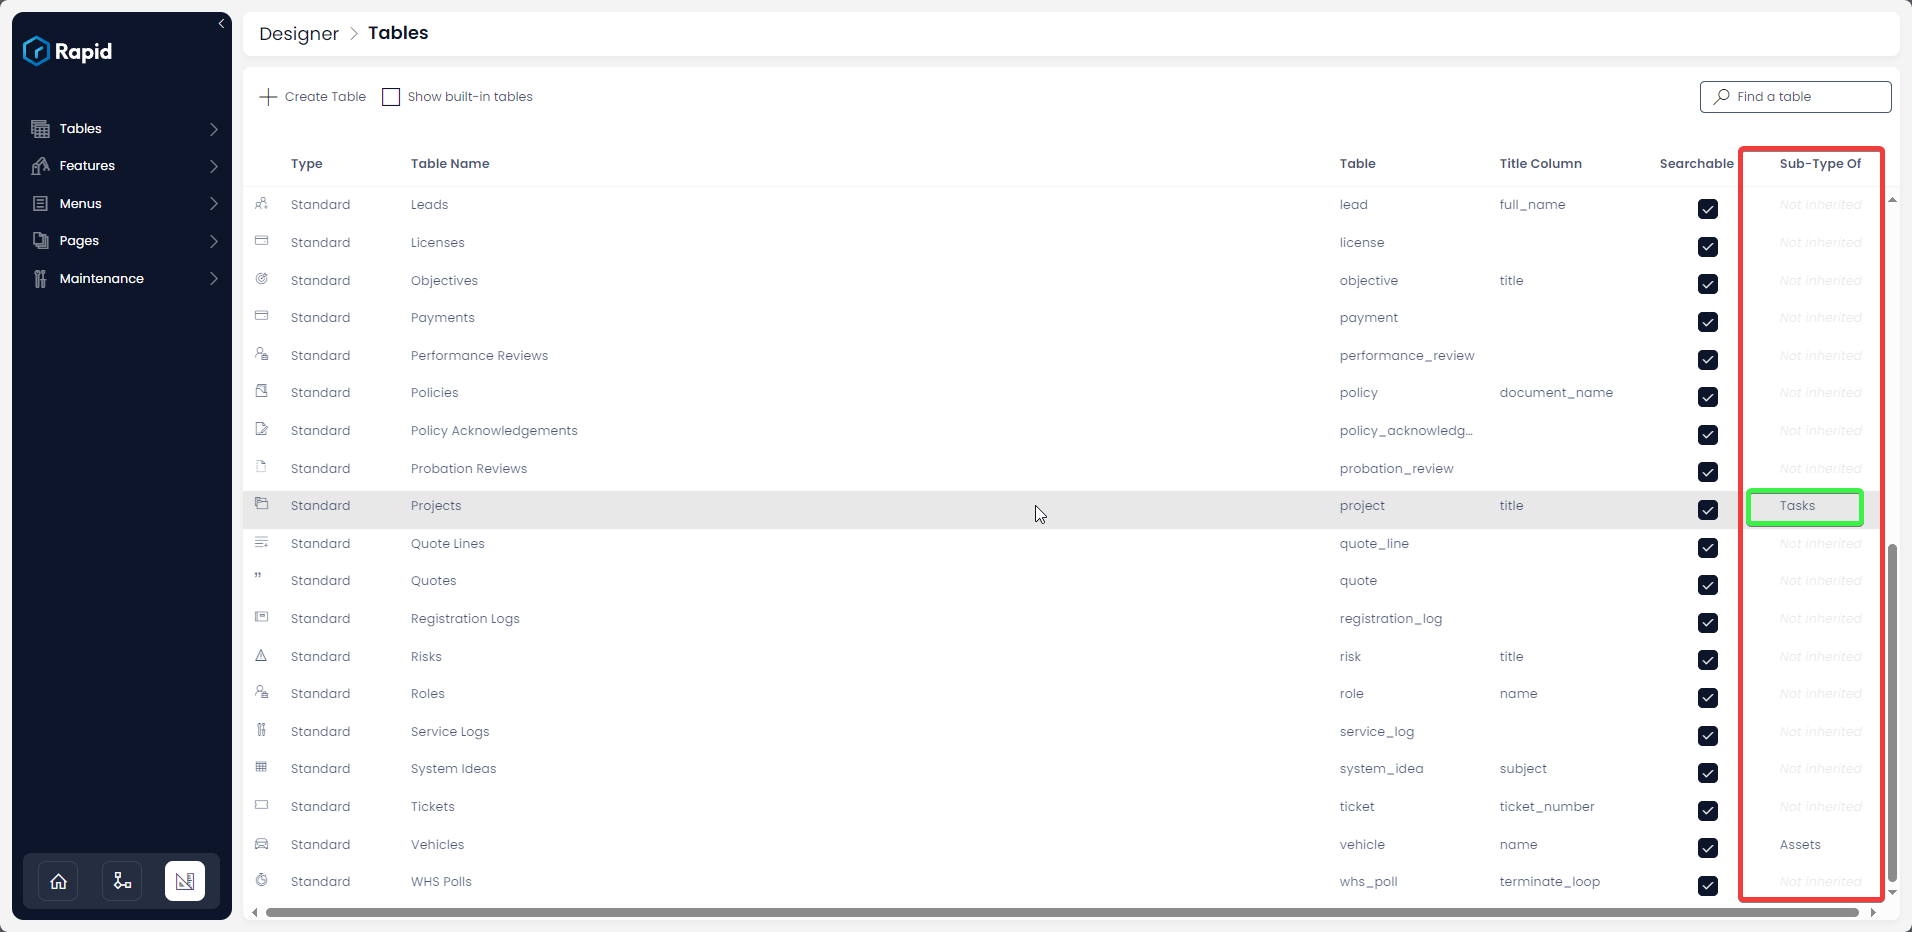
- Check the "Subtype Of" column for your desired table
- If it is a subtype of the "Tasks" table then you can make a Gantt from this.
For example, a Gantt chart CAN be constructed from the Projects table as it is a subtype of Tasks.
Configuring the Gantt Chart Page Component
Please consider the following steps for configuring a Gantt Chart for your Table.
-
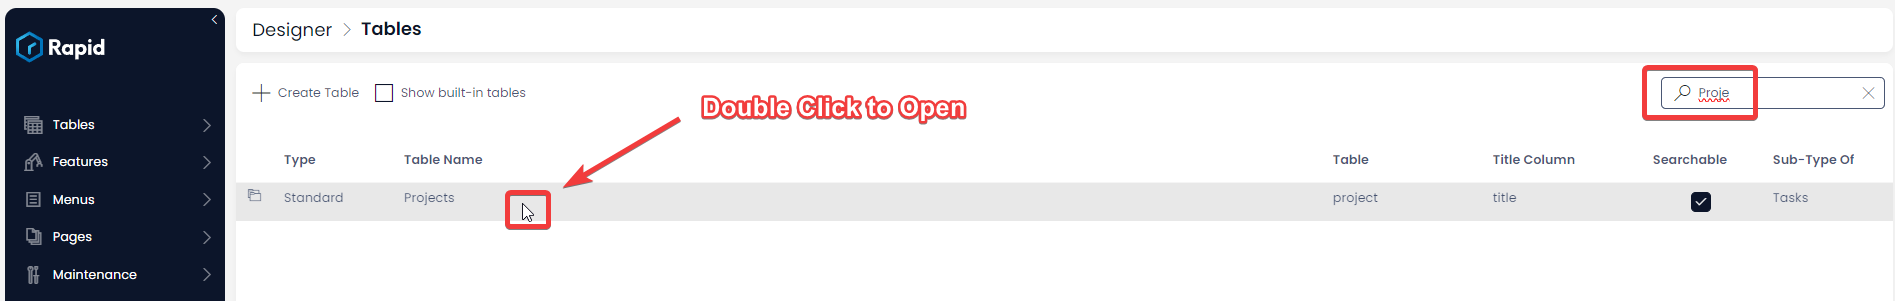
Navigate to Designer > Tables > All Tables
-
Open the Table you wish to configure a Gantt Chart on. (You can scroll through the list or use the search bar to find the table)
-
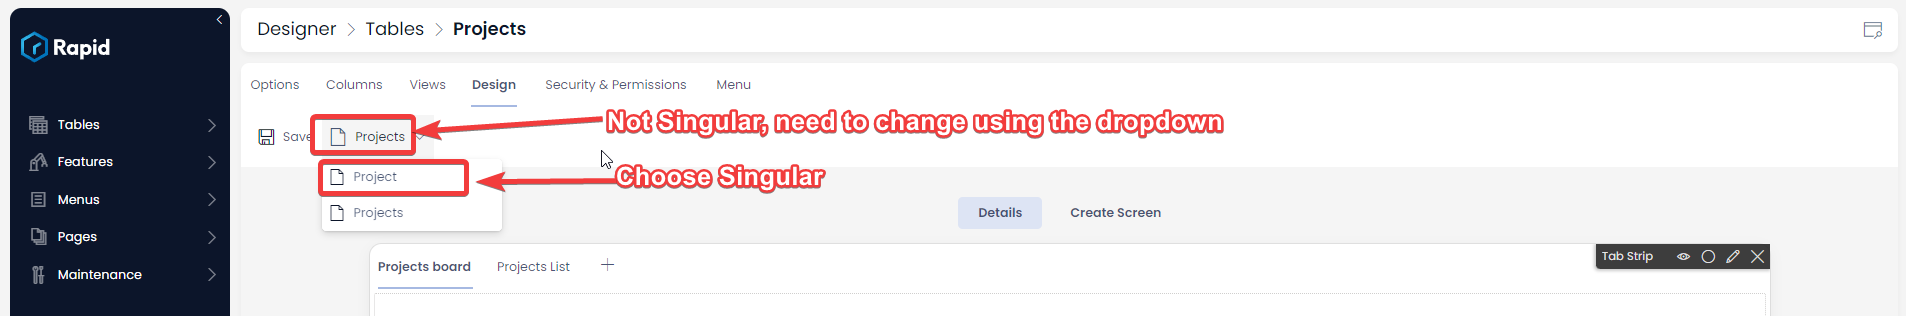
Click the Design Tab
-
If not on the Singular page. Change to this using the dropdown.
-
-
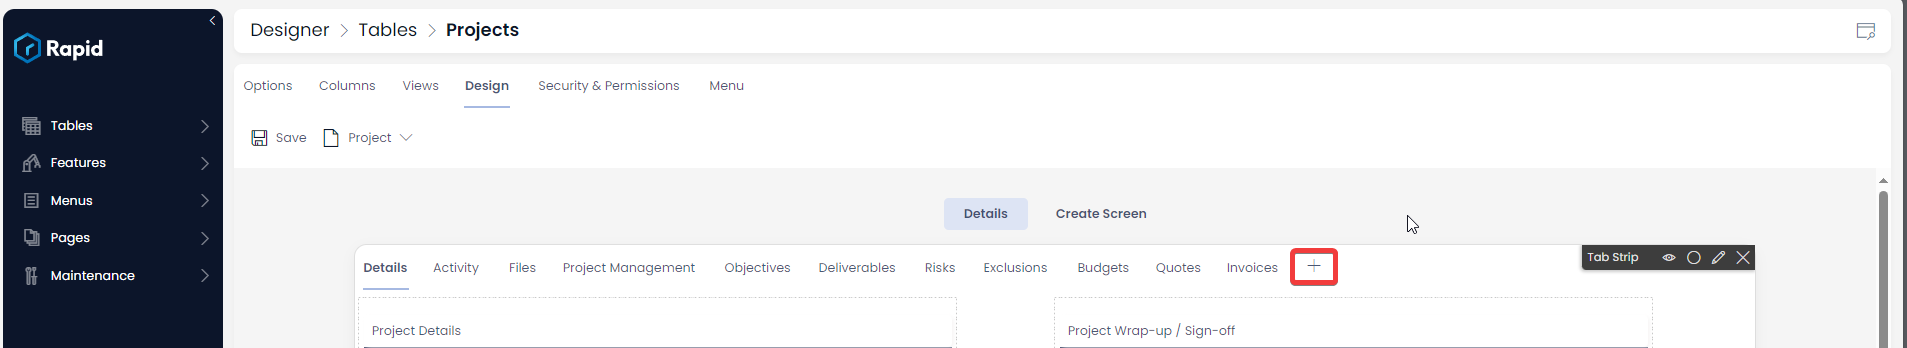
Add a new Tab to the page (For the purpose of this illustration we are placing the Gantt chart on a new tab, but it can also be placed on an already existing tab.)
-
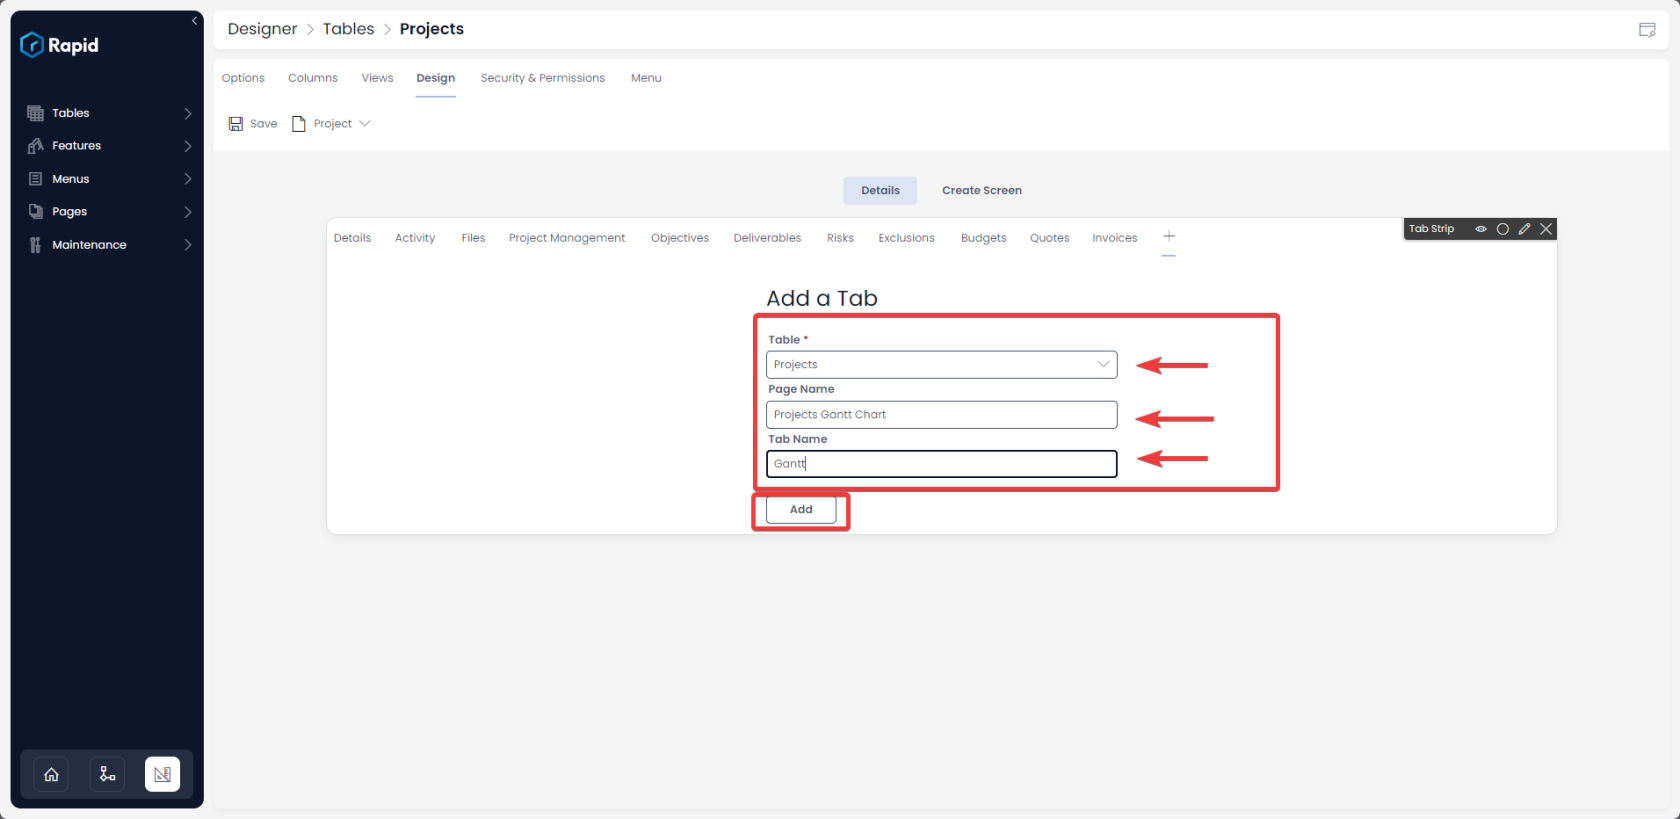
Configure the Tab
-
Select the Table (The name of the Tasks table or Subtype table you are on)
-
Provide an Appropriate Page name. Page names must be unique.
-
Provide a Tab Name. This will be what displays on the Tab strip.
-
Press OK
-
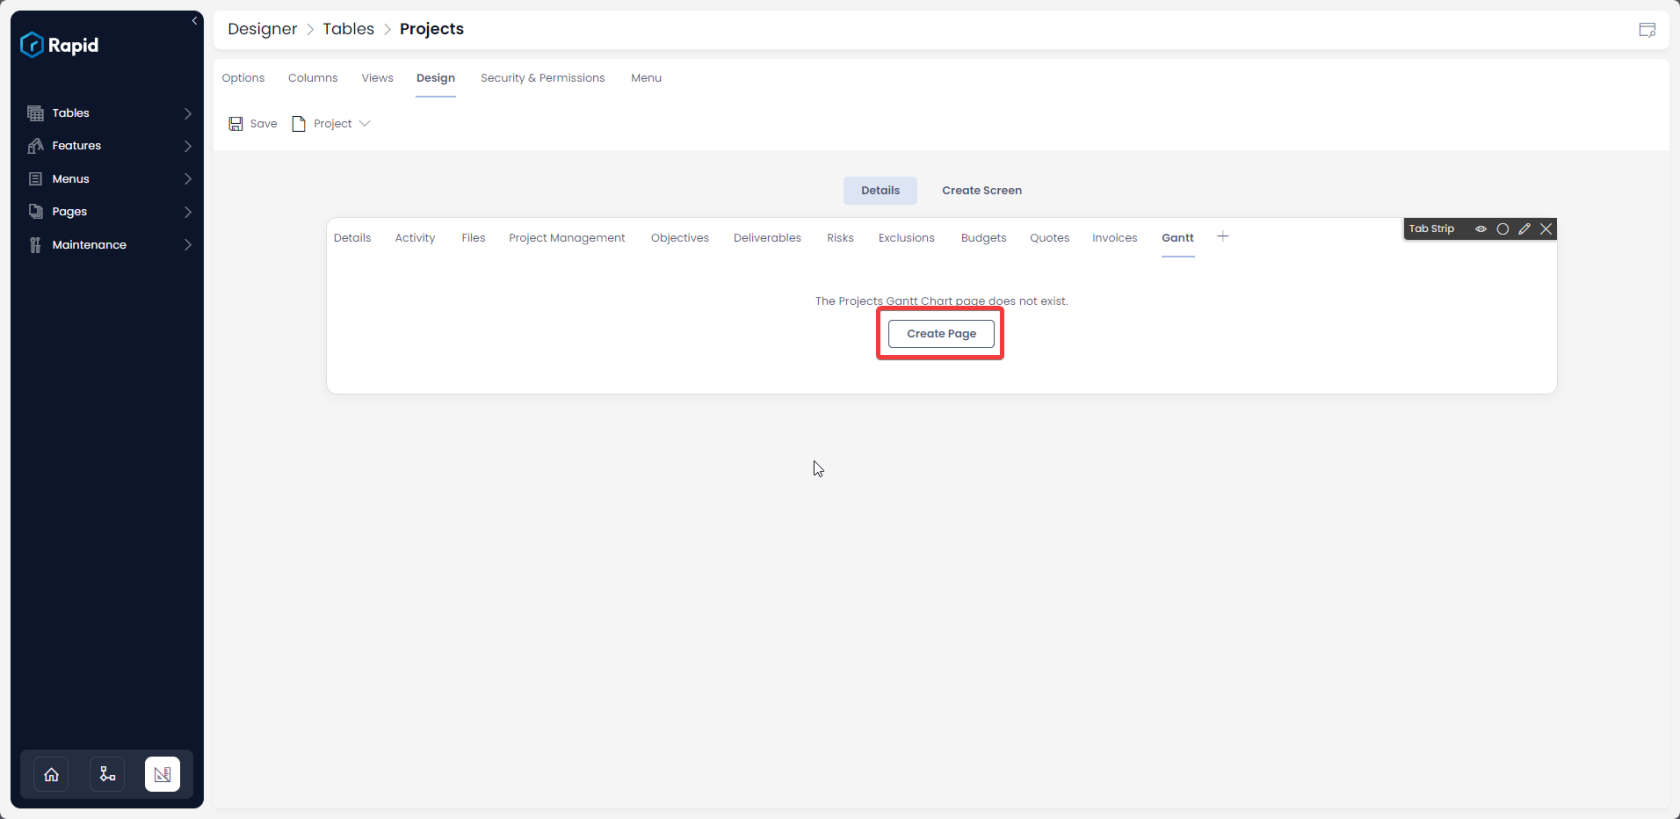
-
Press Create Page (If the page does not already exist)
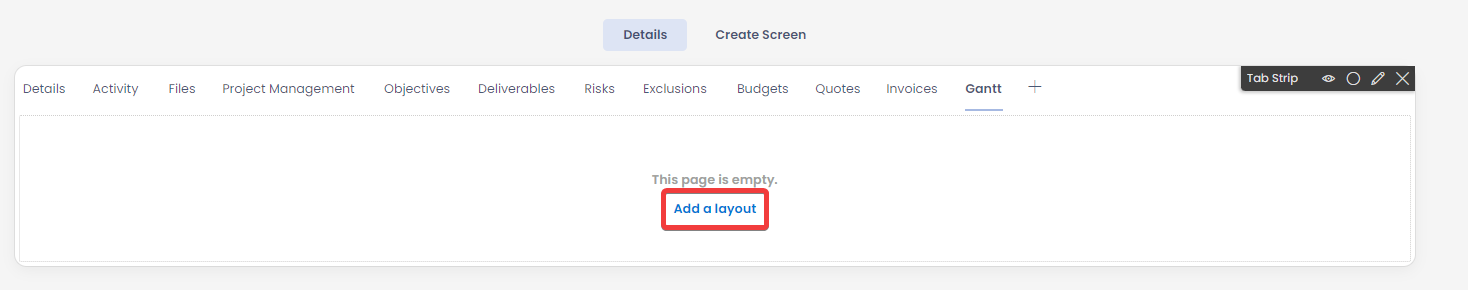
-
Press Add a Layout
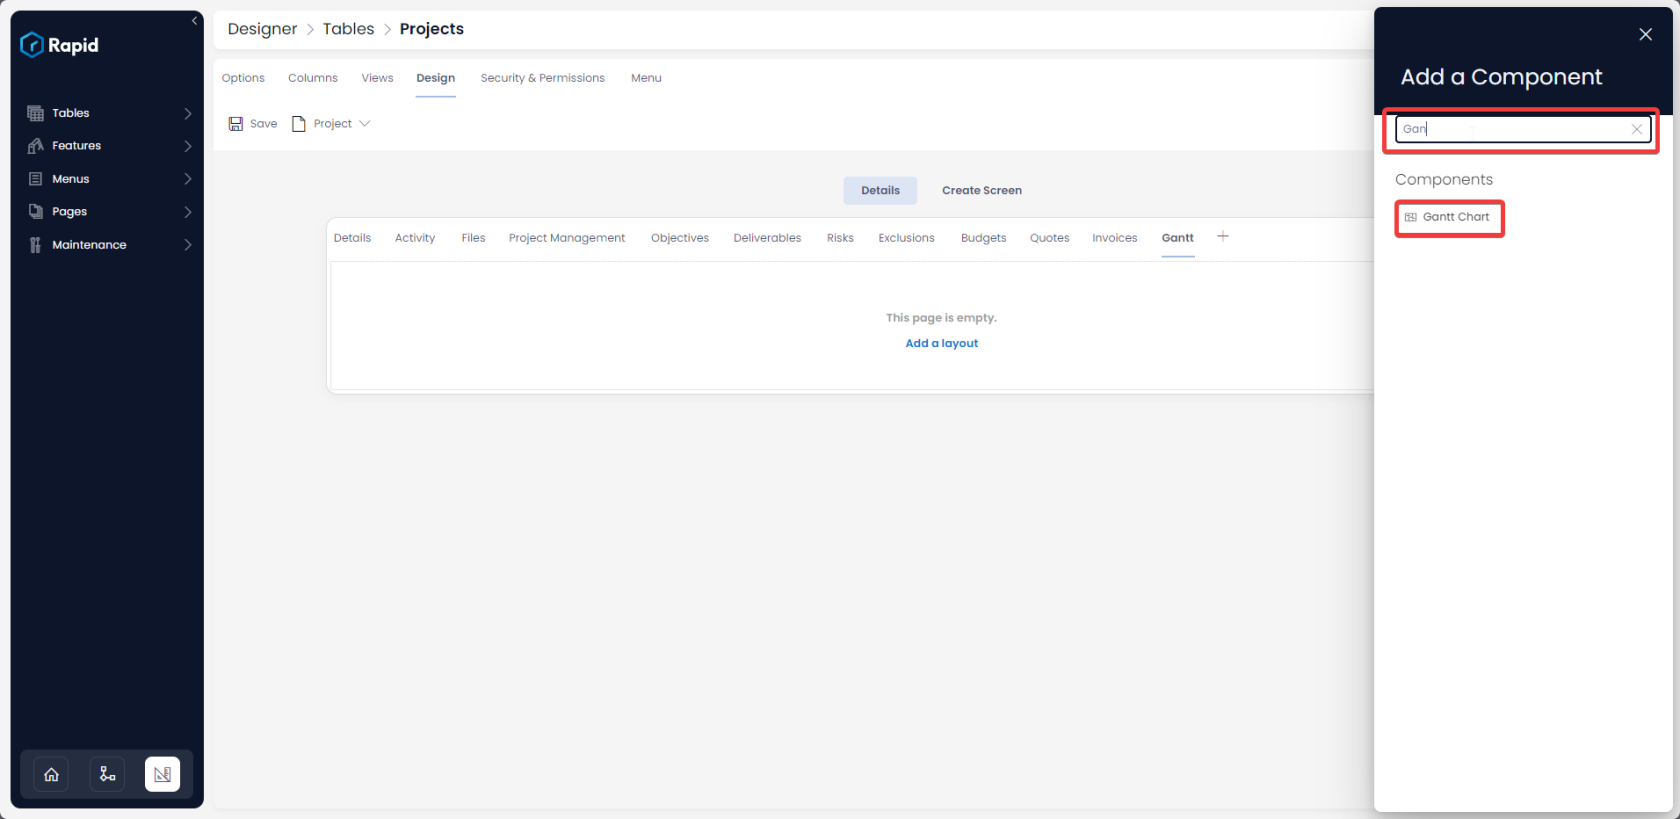
-
Select the "Gantt Chart" Component. Use the search bar or scroll through the list to find it.
-
Select the Edit Gantt Button
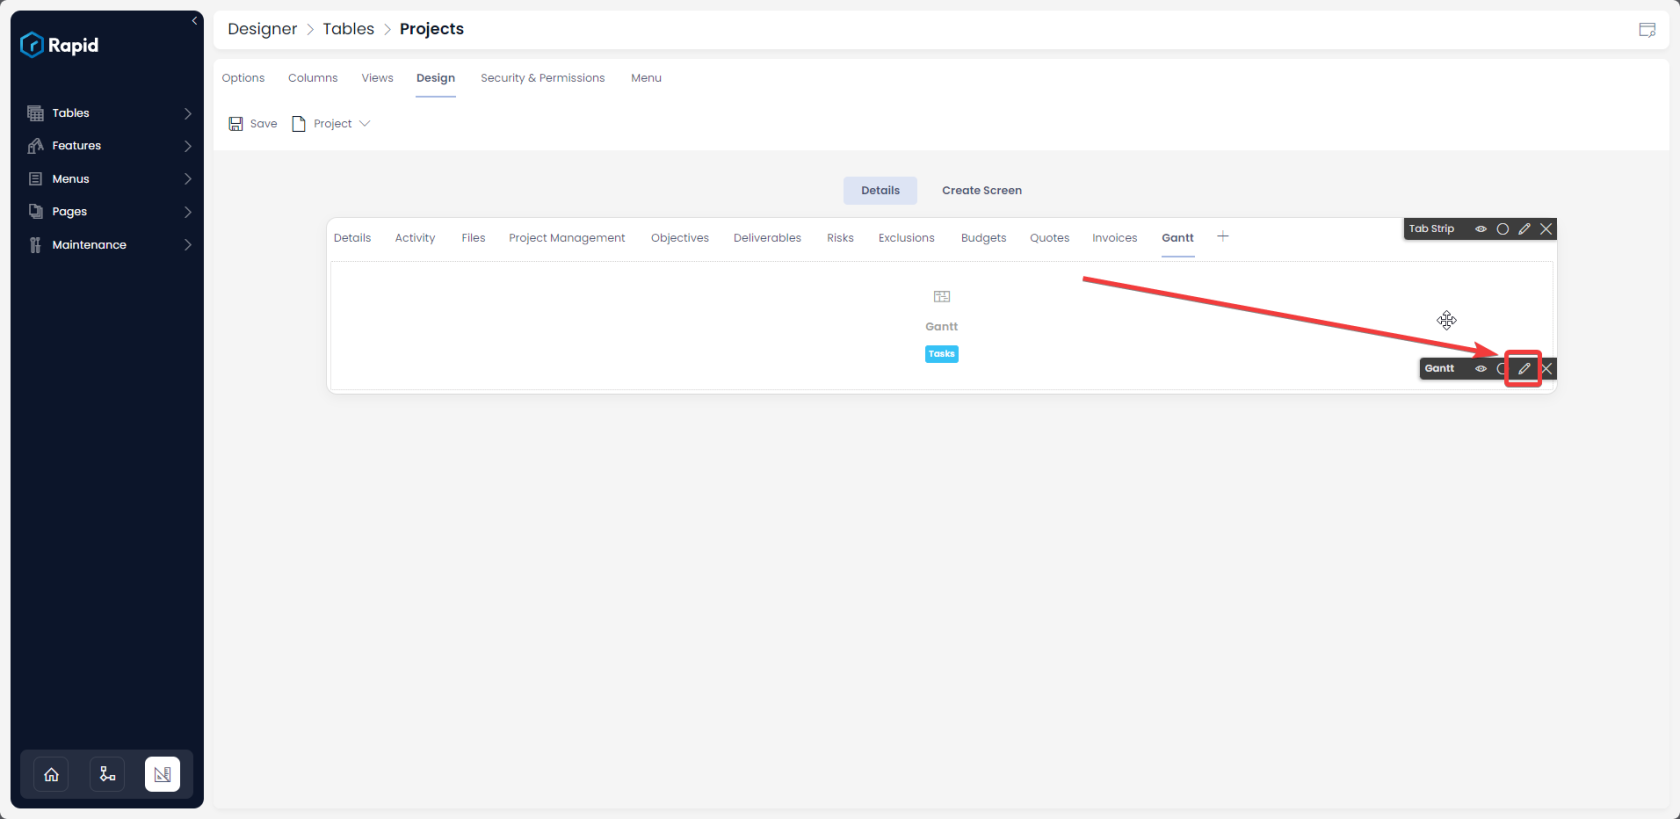
-
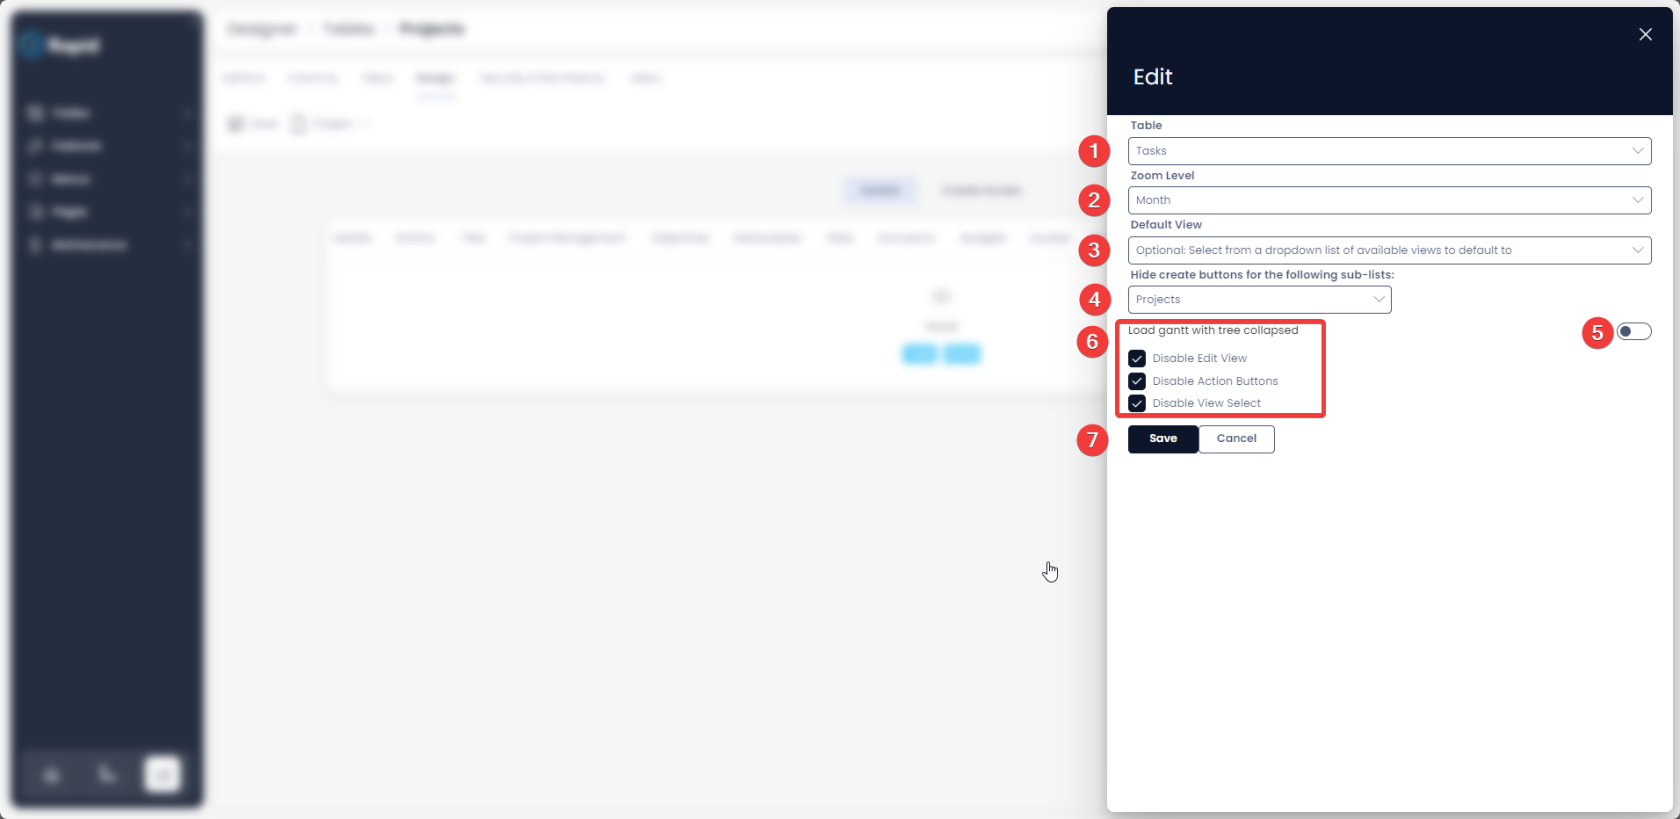
Configure the Gantt Component
-
Select the Table you want the Gantt configured from. In this case a Project is made up of Tasks. So the Tasks lists will be selected.
-
Select an appropriate default Zoom level
-
Select a view. Views can be used to filter out particular rows. (See Views documentation for more information on how these work)
-
If you do not want people to be able to create Subtypes of Tasks from the Gantt Chart Hide this
-
Determine if you want the tree collapsed or open
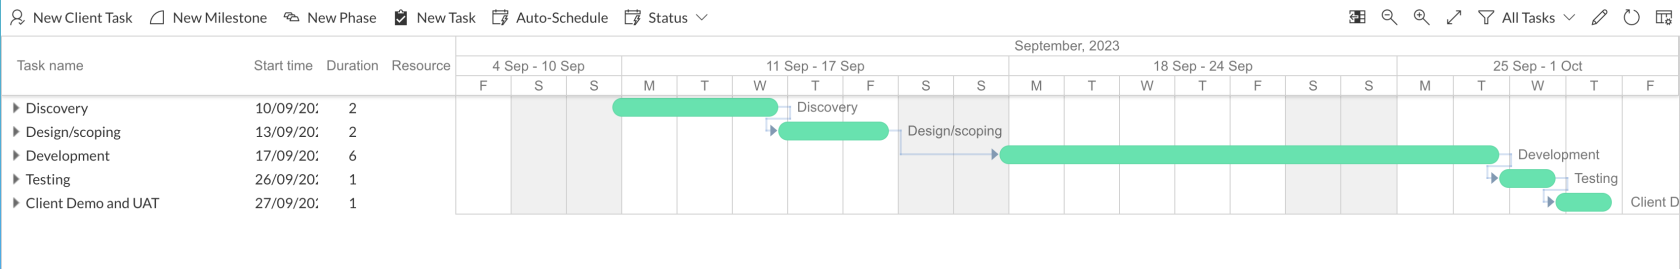
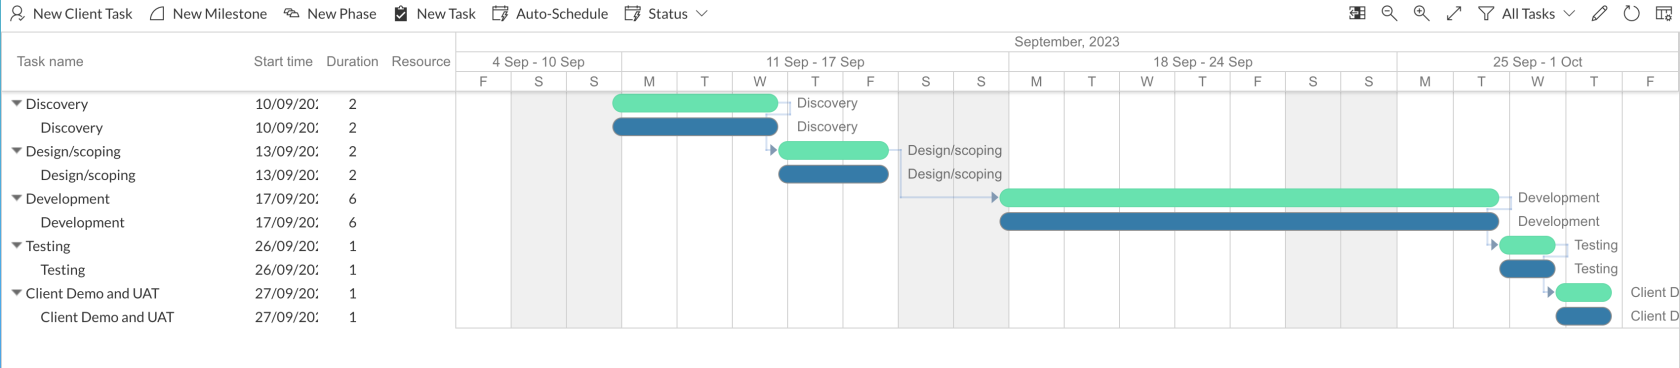
The below images depict how a collapsed and expanded tree may appear in the Explorer view.Collapsed Tree
 Tree with individual tasks open
-
Disable features you do not want users to configure
-
Press Save
-
-
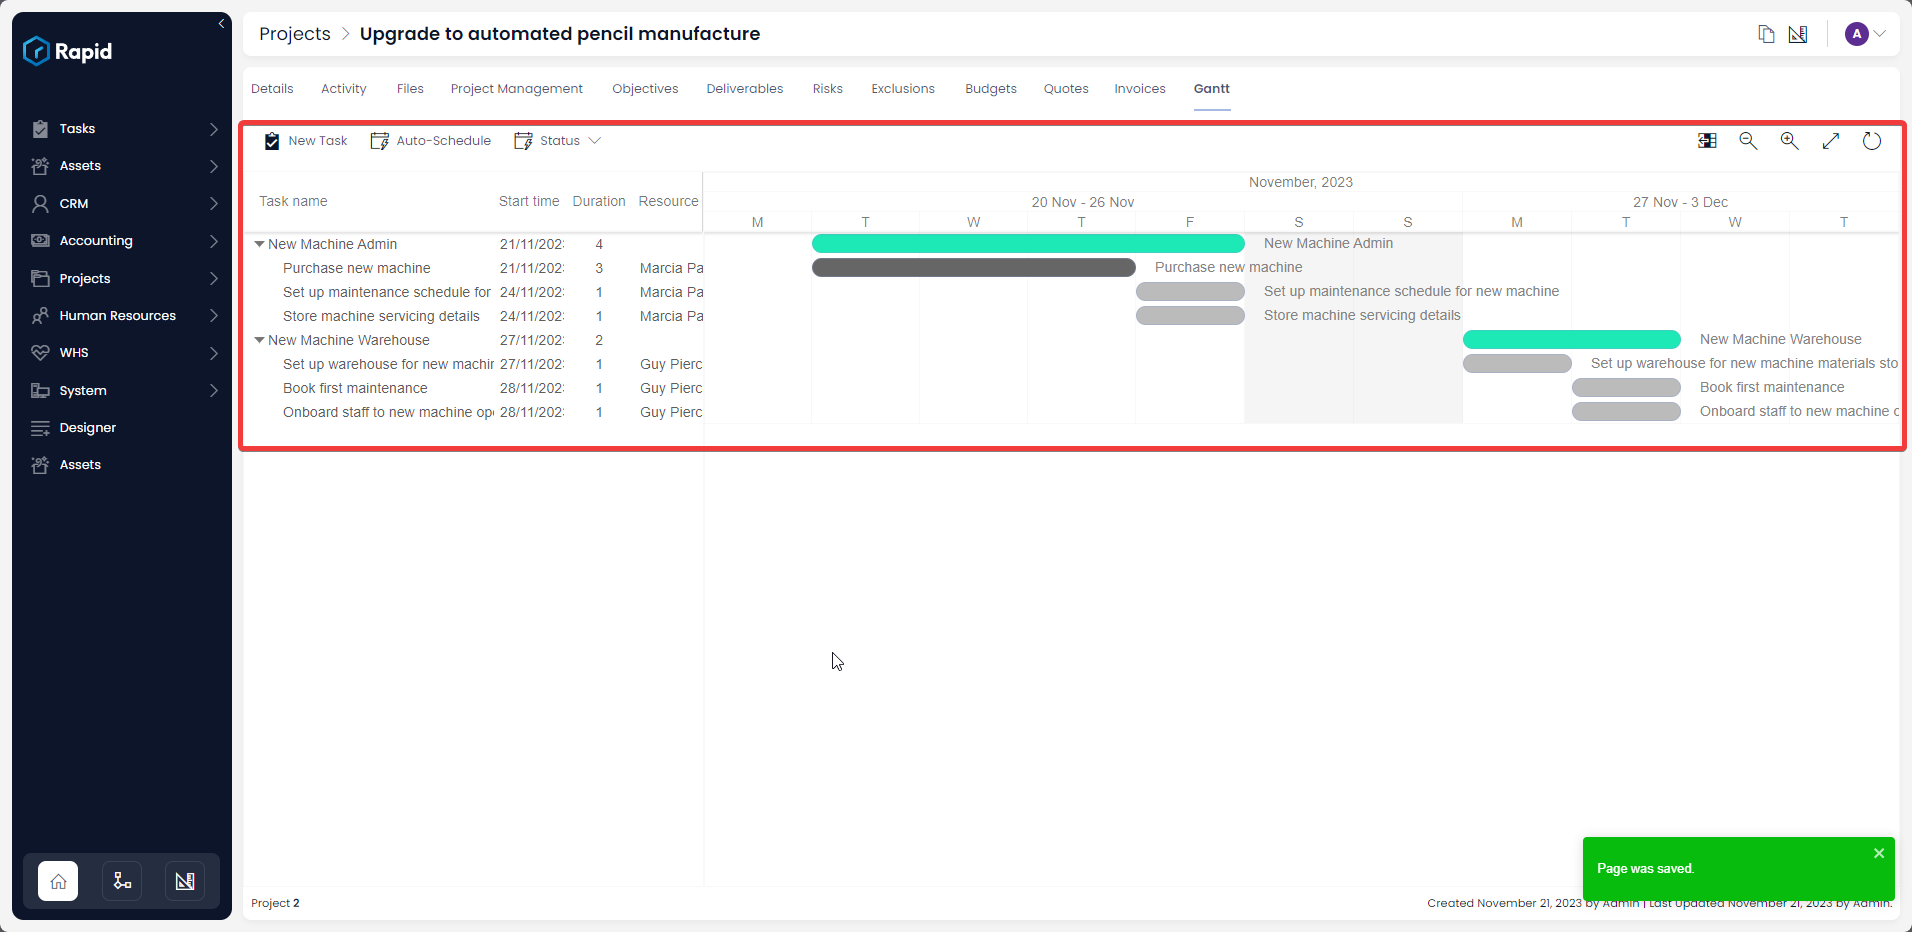
Navigate to explorer, the project and the Gantt Tab to see the produce Gantt.